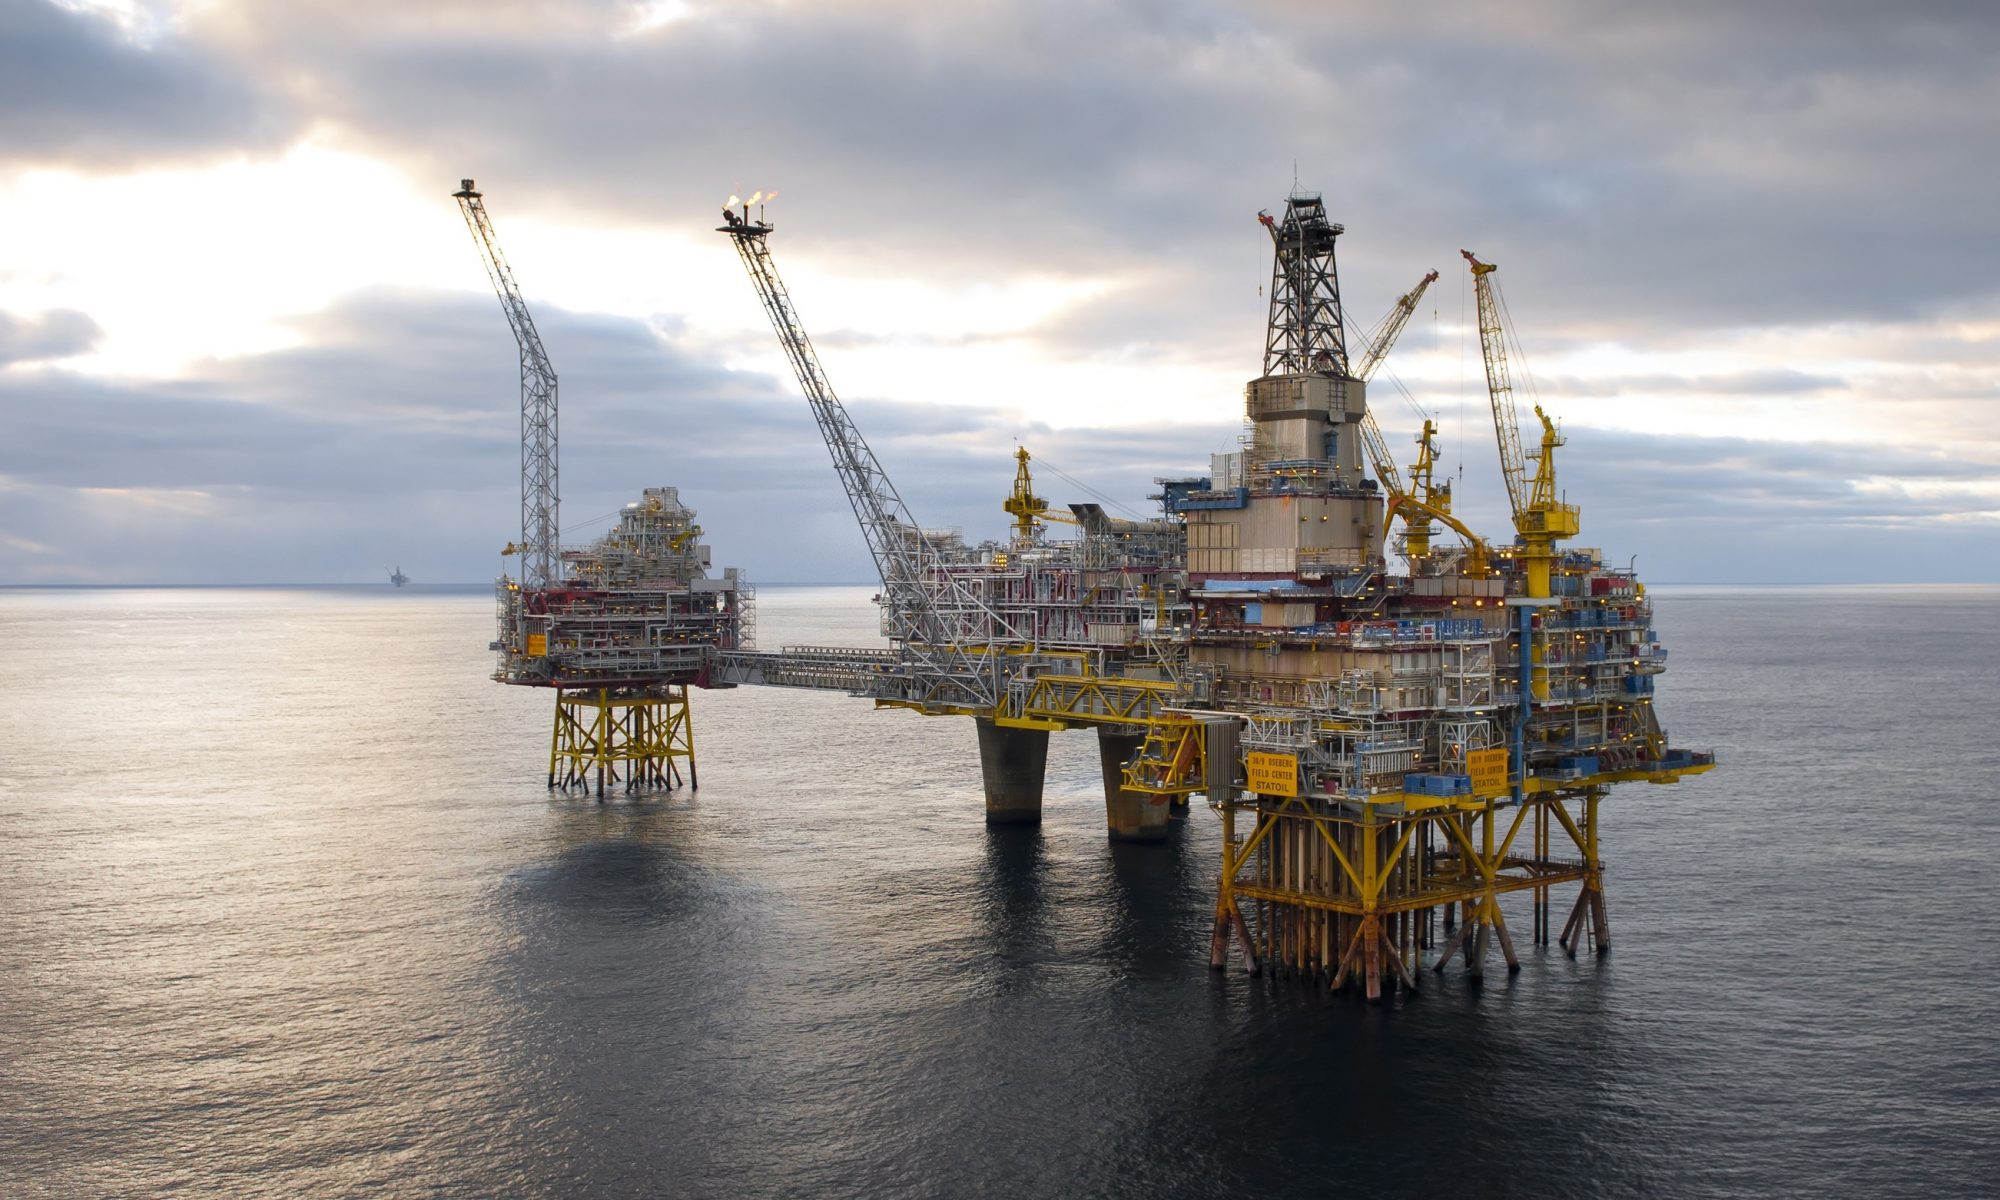
Geology:
Geology (from the Ancient Greek γῆ, gē, i.e. “earth” and -λoγία, -logia, i.e. “study of, discourse”) is an earth science comprising the study of solid Earth, the rocks of which it is composed, and the processes by which they change.
Branches of Geology:
- Economic geology
- Mining geology
- Petroleum geology
- Engineering geology
- Environmental geology
- Geochemistry
- Geological modelling
- Geomorphology
- Geophysics
- Historical geology
- Hydrogeology
- Mineralogy
- Paleontology
- Petrology
- Sedimentology
- Stratigraphy
- Structural geology
- Volcanology
Mud Logging:
Mud logging is the creation of a detailed record (well log) of a borehole by examining the cuttings of rock brought to the surface by the circulating drilling medium (most commonly drilling mud). In mud-logging unit the technical monitoring of wellsites operation also observed and reported if anything abnormal happens in any operation.
Rig Monitoring System:
During drilling operations, the whole rig operations monitored through the sensors i.e. attached with different rig components. some sensors are attached to the rig and some are attached on mud tanks.
Following sensors are attached to the rig floor and on mud tanks:
Mud Tanks & Mud pump Sensors:
- Mud Density, Mud weight sensor (MWO, MWI).
- Mud Conductivity Sensor ( MCO, MCI).
- Mud Temperature sensor ( MTO, MTI).
- Sonic sensor (SLS).
- Degasser.
- H2S Gas Detector Sensor.
- Strokes Per Minute Sensor. ( Mud Pump sensor, MFI (GPM)).
- Casing Shut in pressure sensor (CSIP).
- Paddle Sensor or Flow Line Sensor (MFO)
Rig Floor Sensors:
- Hook load sensor.
- RPM Sensor.
- Stand Pipe Pressure Sensor (SPP).
- Draw Work Sensor.
Mud logging technicians in on wellsite determine the depth of hydrocarbons gases, identify downhole lithology through drilled cuttings, monitor natural gas entering the drilling mud stream, critically monitoring the whole drilling operations through sensors and different drilling formulas & prescribed methods and monitor tripping operations as well, prepared 24/7 rig operations and formed different well logs for Client or operator company. Rock cuttings circulated to the surface in drilling mud are packed in different forms, drilling cutting trays are prepared for the Geological study and maintained Geological lithology record of different well logs.
The mud logging company is normally hired by the oil & gas Exploration & Production companies also called as operator of the particular block. When the rig site is prepared for the drilling operation the operator company representative called the SDL company to mobilize their Unit on wellsite. Before the Spud date the logging unit and it’s crew member reached on site and made logging unit operational and start rig-up. Usually within 48 hours logging unit Rig up operation completed and now the unit is ready to monitor rig operations and geological equipment .i.e. Microscope, sample trays, Different Testing Chemicals, UV box and Geological log PC ready for the drilling operation. When ever spud is carried out the mud-logging unit and its crew members start serving.
Well-site geologist & Surface Data Logging Unit Functions:
The operator company representatives are Company Man or “CoMan” , drilling engineer, and well-site geologist (WSG) take information and technical reports .i.e. operations sheet, Daily Geological Reports from the data logging unit. The logging unit and its crew members are directly comes under the supervision of Geologist, geologist headed the mud-logging and geological related issues. The main duty of the geologist is to study the drill cuttings or geological formation samples comes out from the borehole and alert the company man for any possible dangerous or warn for any unexpected condition that may comes during drilling or tripping out or in.
The mudlogging unit also monitor and keep the logs of all the drilling operations and interpret the drilling quality on the basis of different parameters after careful study there are many parameters that are simultaneously observed by the data engineer. On the basis of drilling parameters data engineer get to know about what is going on in the downhole. Through the monitoring of mud pits data engineer get to know the hole stability and its condition during drilling and tripping as well.
The most Junior member of logging unit is sample catcher, he took drill cuttings from the shale shakers and washed it carefully and after that prepared a sample tray for the geological investigation on site and rest of the gathered sample packed into the bags in wet form and after drying the sample it carefully packed. The geologist come and study the sample critically and then he write the description of the sample and the data engineer saved the lithology and description on different well logs. When the cuttings approached onto the surface and reached on the shale shaker the sample catcher observe the cuttings present on the shaker. The shape of cutting would tells the hole condition. If the large cutting observed on shaker that means the hole is not stable or caved in or hole washout is going on. There are two main types of caving are observed.i.e pressure caving and mechanical caving, this classification is on the basis of shape and size of the caving.
The data engineer played a vital role in drilling operations and it observed and study the operations and hole condition through sensors results. Like if the mud tank level start decreasing rapidly that means something is going on wrong and most probably drilling mud is lost in the formation. The data engineer in that case informed this issue to the mud engineer, CSR and to geologist as well. If high torque and low RPM observed that means rotary is stalling or facing problem in drilling the formation. There are many other interpretation made during drilling a well.
Another important task of the mud logger is to monitor gas levels (and types) and notify other personnel on the rig when gas levels may be reaching dangerous levels, so precautionary steps should be adopted to avoid a possible danger of well blowout or high influx rate.
Measurement While Drilling (MWD) & Logging While Drilling (LWD)
Because of the lag time between drilling and the time required for the formation cuttings to come on the surface, a modern augmentation has come into use: Measurement while drilling (MWD), because of MWD the immediate information related to the well hole shape condition and well hole angle observed through the MWD Survey, no need to wait for the lag or anything like that . The MWD engineer, usually a separate service company set its tools with the Bottom Hole Assembly (BHA) after that whenever needs information related to well bore can be gathered through survey, no need to pullout the assembly through a specific way this survey conducted. After the MWD gathered the information and displayed on their screens distributed on different sights, SDL took that information and updated on software and on different logs as well. Sometimes Logging While Drilling (LWD) tools also used. LWD crew mostly comes when the last section is ready for the drilling, the LWD crew come and attached their tools with well hole designed BHA.
Major Points In Surface Data Logging:
- The rate of penetration in (Figure 1 & 2) is represented by the black line on the left side of the log. The very first track to the left represents the ROP, WOB and RPM. Normally on log, ROP is measured in feet per hour & in minutes per feet in FPS system and in MKS system it would be Meters Per Hour & Minutes per Meters.
- Weight on bit and Hook load directly related to each other if the hook-load increases while drilling the WOB decreases and if WOB increases the Hook load decreases because hook load is the sum of the all weight suspended into the well bore in form of BHA present in well-bore. When Bit is off bottom and the drill string is still connected to the TDS the weight on hook-load is maximum.
- Torque and Revolution Per Minute (RPM) both are important drilling parameters. As torque is the friction faced by the bit while drilling and RPM is the speed in which the drill string is rotated. It is commonly observed that while drilling when torque increases the RPM of the string decreases.
- Slow Pipe Pressure or Stand Pipe Pressure (SPP) and Casing or Choke Manifold pressure is calculated in psi & in Pascal etc. The pressure generated during drilling operations or the impact of formation pressure into the well bore also measured through the pressure sensors.
- Logging unit is able to measure the porosity & permeability as well on the basis of cuttings studies and on basis different formulas. The presence of oil in the well can be detected through the UV fluorescence, if fluorescence is observed with rings that means oil is present. To know that whether the crude oil is dead or active we can easily detect it if the oil seeps up onto the surface of water after the cutting is streaked or cut that means the oil is active and viable for the production and useful for further processing and if no oil float onto the surface of water this means oil is dead and commercially useless.
- When the Sample gathered and prepared on the tray then the geologist carefully analyze the sample and decide the ratio proportion if more than one type of lithology is observed in the sample. The ratio proportion decide on the basis of dominating lithology sometimes traces are observed along the major lithology and so on. in above image of the sample only a fragments of the total sample and some of the sand at the bottom of the tray can not be seen clearly, but concluded in the total estimation. Keep in mind that the sample ratio proportion is around 90% shale, 5% sand and 5% lime (In 5% increments) the percentages are just considered as an estimation for the understanding that how to write interval sample description if more than one lithology had been observed. Different colors and legends indicated different types of rock. Rock types classified on the basis of their composition.
- Calcimetry is an important test that is conducted after every interval. Calci represents the amount of Carbonates present in the sample interval. On the basis of amount of carbonates Geologist is able to decide that whether the rock is limestone, Dolomite, sandstone or another type. In calcimetry test 0.5g of crushed sample in powder formed is suspended into the Calci equipment along with 5 ml of 10% HCl acid. after suspending both into the equipment and tightly packed the engineer shakes it until both sample and HCl mix together and due to the reaction the gas is generated called as CaCO3 and the amount of this gas is recorded on the software.
- The Density of the rock also be calculated into the logging unit by the help of equipment called as Peisometer. Different logging companies has different equipment for the density measurement of the sample rock.
- The hydrocarbon natural gases are measured in different units .i.e. ppm (parts per million), in percentage and in unit as well. The gas detection systems helps us to know about the pressure exist into the reservoir and through the estimation of gas detected on degasser is helpful to know about the success of the well. In (Figure 1) the squared-off dash-dot lines just to the right of the sand (in yellow) and left of the gas (in green) represents the heavier hydrocarbons detected. Cyan = C2 (ethane), purple = C3 (propane) and blue = C4 (butane). Detecting and analyzing these heavy gases help to determine the type of oil or gas the formation contains. If the oil is present in the reservoir it is possibly be detected through the cuttings study. After applying some chemicals on the sample cuttings it may be acetone, phenaphthalene etc.


